To identify problems and trends and to trouble-shoot them requires observing events over a period of time (historical monitoring). Since it is generally impossible to observe all interesting events as they occur, most services (daemons) record important events to files known as log files (or logfiles). Log files are used for debugging, for audits, for evidence in legal actions, for incident response, to reduce liability, and for various legal and regulatory compliance reasons. For example, email logs can alert you to spam problems, web logs may be useful for marketing and website design, and database logs can show inefficiencies with popular queries. When upgrading or deploying new (or newly configured) services, log data can be valuable in finding problems quickly. (For instance, failure caused by incorrect permissions on some file.) Log files can show daemon resource usage (CPU, memory, disk, and network utilization), useful for capacity planning and (for developers) efficiency tuning.
Note that system administrators have almost no control over the content of log messages. That is strictly up to the developers of that software to include needed and informative log messages. When evaluating software, keep your logging needs in mind! Don't be afraid to open an issue with a vendor about a poor or missing log message.
In most cases, log files are plain ASCII
or UTF-8 text files, with one record per line.
The more modern journald logging system
(part of systemd) uses binary log files that cannot be directly
examined with standard text tools such as
less and grep.
You should use the journalctl tool.
(I am old school and prefer plain text log files!)
Other operating systems have logging daemons that use binary files as well,
such as Microsoft's Windows event logs; such logs require special tools to
view and search.
Log files can be categorized by their intended use. This can be useful, since all logs for a given purpose tend to be treated similarly. Some examples include debug logs, audit logs (including security event logs), non-security event logs (useful for marketing and other uses), and performance logs.
In the early days of the Internet, service daemons managed their own files. That meant system administrators needed to configure logging and manage the log files for each service separately. That was a hassle! Also, each daemon's log files had different formats, making it difficult to find and correlate events. BSD Unix somewhat standardized syslog message formats, which were documented in RFC (RFC 3164 ).
Today most (but not all!) daemons on Linux can use a standard logging daemon
called syslog (or a similar name) to collect, identify
i.e., host, command name, and process ID),
add time-stamps, filter, store, alert, and forward logging data.
Using a system logging daemon has the added benefit of somewhat standardizing
log file formats, making it much easier to examine log data with various
standard tools.
Here's what syslog data looks like (line-wrapped for readability), taken from a security event log (with IP addresses changed for anonymity):
Jan 28 06:17:54 YborStudent sshd[14588]: Invalid user test from 125.243.249.194
Jan 28 06:17:56 YborStudent sshd[14588]: Failed password for invalid user test
    from 125.243.249.194 port 51440 ssh2
Jan 28 06:17:58 YborStudent sshd[14590]: Invalid user guest from 125.243.249.194
Jan 28 06:18:00 YborStudent sshd[14590]: Failed password for invalid user guest
    from 125.243.249.194 port 51586 ssh2
Jan 28 06:18:02 YborStudent sshd[14593]: Invalid user admin from 125.243.249.194
Jan 28 19:19:50 YborStudent sshd[18313]: Accepted publickey for wpollock from
    72.186.232.55 port 62487 ssh2
Jan 29 07:12:54 YborStudent sshd[18052]: Accepted password for ub09 from
    170.12.45.53 port 1403 ssh2
Daemons are usually configurable with the level of detail they output as log data. Too much data can obscure important events! Generally, you only need to log errors and security events. When debugging some service, you will increase the level of detail in the logs to help find the problem. Once solved, the level is lowered again.
Using a system logging daemon such as syslog provides another way to work. You can have the various service daemons output maximum level of detail all the time, and have syslog filter out most of them and only store errors and security events. This means when troubleshooting some service, you increase the retained log level using syslog and you don't need to reconfigure the service daemons at all. This is usually easier, but is less efficient than not having daemons produce unneeded log data in the first place.
Logging is related to, but distinct from, monitoring. Monitoring services means collecting metrics about their health and performance. Monitoring can be useful to alert you to issues, but won't help with troubleshooting them or recording security events. So generally, both logging and monitoring systems are used. (It can be confusing since log data has timestamps in each message and can thus be used to produce some metric data; also metric data can be used to produce some log data. However, generally the two systems are independent.)
Syslog was developed first for BSD, but there was no standard for it, resulting in many somewhat incompatible “syslog”s.) Eventually, standards for syslog were developed, based on more popular BSD syslog formats.
For some time now, most daemons send logging data to syslog by default. However some daemons may need to have their logging configuration changed to have them take advantage of syslog (or indeed, to provide any log data at all).
Log files need to be examined or they are useless.
However it would be foolish to try to read all log data, all the
time.
Since it is impossible to know in advance what log data will be useful,
you end up collecting far more than any human (system administrator, or just
“sys admin”) can possibly read or understand.
This can be managed with log alerting and parsing (a.k.a. data
reduction) tools.
Such tools will alert you to unusual log entries and inform you of the number
of logs of each type.
Usually these alerts and summaries of the log data are sufficient to show
potential problems, at which time you would then examine the
relevant log entries.
Some data reduction tools include
logwatch, logcheck,
swatch, logsurfer, and SEC.
Other utilities include GUI
tools to examine and mange log files, and standard text processing
tools such as grep, tail (especially
tail -f), and less.
(For example, to find log entries for some service on
some date, in some logfile(s):
grep service logfile |grep date |less).
More sophisticated tools will try to understand the log data and
provide alerts based on their meaning, however such tools usually
cost money.
Today, monitoring systems are preferred for alerting. Using logs for alerting is the second-best solution but useful if you don't have monitoring in place. Once alerted to some issue, then you examine the logs.
Fedora uses logwatch for data reduction by default and it works
fine, but doesn't examine all logfiles by default.
Which service log files are monitored is controlled by the files in the
/etc/logwatch/conf/ directory.
Each service to be monitored (other than the defaults) must have .conf files
in conf/services.
The logwatch tool examines various syslog-formatted log files,
collects info about each, and
emails a report (daily by default) to the system administrator.
This works well for standard, well-known services where you expect few
issues.
For custom or newly deployed services, you will want more immediate alerting
than logwatch provides.
A bunch of sample logwatch .conf files you can use can be found in
/usr/share/logwatch/.
Suppose you decide to use Sendmail.
Logwatch doesn't monitor Sendmail's log files by default.
To have logwatch monitor Sendmail, copy the default sendmail.conf
to /etc/logwatch/conf/services/.
That's it!
To get more details in the reports, crank up sendmail's LogLevel
setting from (the default of) 9 to 15 (see
/etc/mail/sendmail.{cf,mc}).
You on;y need update Sendmail's configuration once.
By default, syslog will filter most of the resulting log messages out.
To get more detail, change the value of “detail” in
logwatch's sendmail.conf file from (the default of)
3 to 4 (max is 10 for most detail possible).
View a Sample logwatch report.
Syslog standards are over 20 years old (RFC-3164 was issued 2001) and many issues have surfaced with them (see below for a discussion of these). A sys admin must address the problems of their installed syslog. Newer IETF standards (RFCs) for syslog have been developed (RFC-3164 was replaced in 2009 with RFC-5424) to address security issues and other syslog shortcomings. Some distributions still ship with a basic, old syslog daemon only, but a number of replacement versions (some are compatible) include many newer features. You should see which syslog daemon your hosts have and replace them with newer ones, if at all possible. See syslog-ng, module syslog, SDSC-syslog, rsyslog (used by Red Hat and others since it is backward compatible with old syslog, has many new features available, and comes with an open license), and nsyslog. However, most of them use similar configuration to syslog, so that will be described here.
There are also log aggregators, which can combine logs from *nix, Windows, Android, or whatever; see (for example) nxlog.)
Note that most network devices today can also produce syslog data. Don't forget to collect logging data from all important sources, including network devices (routers, switches, firewalls), printers, workstations, and Windows servers. Use SNMP/RMON to monitor network devices that don't support syslog compatible log format.
For most distributions of Linux,
you should examine various log files in /var/log,
especially the main (default) log file messages.
To see boot problems, hardware issues (and identification) use the
dmesg command (and look in /var/log/boot.log).
After your first boot, copy /tmp/install.log
to someplace safe.
(You must do this on first boot as /tmp gets erased on reboot.)
The secure log is also very important to monitor.
Other log files include audit/*, for SE
Linux and related log messages.
Some distributions of Linux and most Unix systems keep log
files in other locations.
To find out where some system keeps its standard logs,
check that OS's admin guide, or use Internet search.
Use the ls command to see existing log files in that directory.
There are additional, non-syslog files maintained you should know about in
/var/log:
wtmp is a log of who logged in and when
(This is a binary file, so view with last command
and manage with the Linux sessreg command).
utmp is a binary file (not a log) of who's logged in
now.
Two related files may exist:
btmp (a log of failed login attempts)
and lastlog (not a log file but a sparse file
— examine it with ls -l and du),
which shows the last login per user id (view with finger
and lastlog commands).
You must manually create btmp and lastlog
via touch if you want Linux to use them.
Tip: Not sure which log file has the entry for some event that just occured? The command
ls -lt /var/log |head
will show the ten most recently modified log files.
With the introduction of systemd, logging was changed to a binary format
viewable with journalctl.
These journals are configured separately from syslog files and have advantages
over traditional per-host logging daemons.
However, not all services use these journals and still use syslog.
The easy solution is to configure systemd's journaling system to send log
data to syslog too.
You can then use journalctl on those services that support it
and use your traditional syslog tools on the rest.
(This does mean some log data will be duplicated; fortunately disk space is
very cheap nowadays.)
Keep in mind you don't want to rotate binary log
files!
(You may wish to back them up occasionally; note journald handles
that and log file truncation for systemd journal files.)
Log rotation is discussed, below.
Common IDSs include file integrity checkers such as tripwire, osiris, and samhain. Snort is a common NIDS scanner.
UDP/514 for traditional syslog.
Note! UDP is not secure
and you should only allow selected hosts (a white-list)
to use that port.
It is much better to use a modern syslog replacement with secure
transport.
(Note syslog must be started with the “-r”
option or it won't listen to the network.)
Harvard University collects syslog data from each switch, hub, router,
firewall, and server.
Reportedly (;login: 4/2011
), they collect data from 3,500
devices and 400 servers.
All the data goes to a central loghost, running commercial data
collection/indexing/monitoring/reporting software, called
Splunk.
The loghost collects about 18 GB of log data per day,
which is why Perl scripts (e.g., logwatch) and other
“home-grown” solutions don't scale.
Loghosts are attacked by hackers, so when using the old BSD
syslog, it is sometimes worth the work to build a stealth loghost.
(Don't do this if you can use a modern version os syslog that uses a
secure transport!)
Such a host has one NIC connected to an inner network and is used for
SSH connections by the administrator or to relay log
data.
The other NIC is on the LAN from which you are collecting
the log data.
This NIC is unnumbered and set in promiscuous mode.
You use various tools (netcat, a.k.a.
nc)
to monitor the network for UDP log data sent
to a fictitious address.
The various hosts on the LAN will try to send their log data to that
fictitious host.
Log data is sent via UDP, so the sending hosts won't
know the difference.
An attacker can't access such a stealth host.
(Be sure to turn off ARP on that NIC as well, or attackers can find it.)
A stealth loghost doesn't prevent log injection, but since this makes it
impossible to access remotely the loghost from the public LAN, it does
prevent some attacks.
/dev/log
device (and similar ones in chroot jails).
Note, some daemons will refuse to write to log files if they have
insecure permissions. If possible, digitally sign each log entry when added to the log file. Before a party may move for admission of a computer record or any other evidence in any U.S. court of law, the proponent must show that it is authentic. Some syslog replacements do this already.
A different key should be used to digitally sign the whole log; either after every entry is added or after the log file is closed/rotated. This is an example of a dual control that prevents a single person working alone from falsifying data (e.g., hiding financial transactions to embezzle funds). Digital signatures can do this (along with a copy of your logging policy, often part of the security policy, that shows your data handling policies). See justice.gov/criminal/cybercrime/usamarch2001_4.htm (a PDF copy).
As a rule of thumb, syslog data can be kept on-line up to a year; 3 months or 6 months are also commonly used policies. Older data can be summarized for baselining purposes, and only the summaries kept on-line. You need to archive the old logs according to law and your data retention policy; generally three years. In part, how much old data you keep on-line depends on how much will fit on one backup tape/CD-ROM/DVD. If 4 months of log data nearly fills one tape, than 4 months on-line may be a better policy than 6 months on-line.
one-way) function is a good technique for this.
Note that blinding, encrypting, and not keeping data are general techniques, not well suited to system log files. However it still pays to consider these issues.
*****”.
Replace any non-ASCII with question marks or encoded data
(for example, base-46 or percent encoding).
When using Unicode (and not just ASCII), always normalize
all log data not generated by syslog itself.
(Again, this is mostly a developer issue, but you can certainly ask them!)
See the Unicode Normalization FAQ for more information.
stunnel) for transport of syslog data.
Set up tunnel on each remote host so data sent to localhost port 9999
(or any unprivileged port) gets automatically forwarded to the
loghost via the secure tunnel.
Here's an example using netcat (nc) for the tunnels:
On client:     nc -l -u -p syslog | nc localhost 9999
On loghost:    nc -l -p 999 | nc localhost -u syslog
What gets logged by syslogd and where it goes is controlled by
/etc/syslog.conf.
In the past (and to a small extent today), servers had
hard-coded filenames to use for their log files.
This is a very inflexible scheme, and log files would wind up
scattered all over the disk.
A modern system uses syslog to centralize logging.
A single configuration file can control what gets logged
(and what gets ignored), and where the log messages should go.
The log data is simply text.
Syslog will add some additional data to that: a timestamp, the hostname,
the process name and PID number, and optionally a string called the
tag.
What gets logged also depends on what a server (daemon) sends to syslog. Most services have configuration setting to increase or reduce the amount of log data then generate. There are two common setups: have syslog save everything and let the sys admin control the amount of log data by configuring each and every service (each service configuration file may use a different syntax), or have the services generate lots of logging data, and let the sys admin control what gets saved to log files by configuring only syslog. The first approach is less wasteful of CPU and RAM resources, but more demanding of the sys admin.
Here's how it works:
A program uses the syslog API (library) function
or uses the logger program for shell
scripts) to send a log message to syslogd.
(Some modern service daemons use Systemd's journal API instead.
However it is possible to have journald send any received log
data to syslog too.)
Syslogd will also read log messages from sockets
(by default just /dev/log, but others can be used),
and if started with the right option, also from the network.
The information passed to syslogd includes the source of
the log message (called a facility) and the
priority of the log message.
Optionally, a a short string called a tag is also passed.
Syslogd then matches the facility and priority against
selectors (combinations of facilities and priorities)
in its configuration file, and if a log message matches a selector(s),
the message is sent to the corresponding destination(s).
This is a primitive form of log message filtering, especially considering
that syslog trusts programs to set the facility and priority accurately.
There's only a small list of facilities in syslog, with no prevision for adding more. Data reduction tools can also filter on the tag string, but not old syslog.
Syslog-ng and other recent syslog replacements allow more sophisticated filtering, using facilities, priorities, and arbitrary regular expressions.
Note that many PAM modules send log messages to syslogd,
and use only one or two facilities for all daemons.
So even if you have a dedicated facility for some daemon, some of
its log messages may end up in a different log file than the one
you expect.
Some systems use a separate log daemon for kernel messages,
often called klogd that you may need to configure.
(With Fedora, klogd just passes messages to syslog via
the “kern” facility.)
(The original syslog syntax is described here.
It is compatible with rsyslog without change (except for the filename,
rsyslog.conf),
but not with other syslog replacements.
See the tutorials for your specific syslog daemon for their syntax and extra
features.)
Aside from blank lines and comment lines, syslog.conf
has rule lines, with two parts:
When a log message is processed by syslog, the message's facility and priority is compared with each selector in turn. If the selector matches the message, the action is done. So a given message may be handled by multiple actions, if multiple selectors match.
In many older syslog daemons, the selector and action must be separated with a TAB, and not just spaces! If using one of those, make sure your text editor doesn't replace the tabs when you edit the file.
The source of a log message is referred to as a facility.
For example any email related program that sends a log message uses the
mail facility no matter what the name of the program actually
was.
When a daemon sends a log message to syslog, it includes the facility
syslog should use.
Note that syslog trusts daemons to use the correct facility when
sending a log message.
Since this is defined by the programmer, in some cases the facility
may not be the one a sys admin would expect.
There is no way to define your own facilities but there are many predefined ones (up to 23 in all, depending on which syslog you use):
auth
(Security events get logged with this) authpriv
(user access messages use this) cron
(for cron, at, and anacron, but not for the programs started by them) daemon
(other daemon programs without a facility of their own) kern (kernel messages) lpr (print system; the name comes from
line printer) mail mark
(used by syslogd to produce timestamps in log files, to show syslog is working
if there's no log messages for a long period) news
(NNTP usenet/netnews/newsgroups)syslog (errors from syslog itself) user
(for user programs) uucp (obsolete form of networking) local0 – local7
(any use; RH uses local7 for boot messages) * (for all) Note that syslog trusts the software to use the correct facility when sending a log message.
Due to the limited number of facilities available, it is
inevitable that some services will wind up using the same
facility for their log messages.
Syslog allows programs to supply an identifying string, known
as a tag, that syslog will prepend to each line of
the log messages.
This permits easy selection using grep or other
tools, to filter only the log messages of interest.
However, older syslog cannot use the tag in a selector.
(You'd think that modern syslog replacements would add new facilities. A few have, such as for NTP, but most just stick with the standard facilities.)
The priority is one of the following eight levels, which are ranked in order from high to low priority:
emerg alert crit err warning notice info debug
(or “*”) When specifying a priority, that and all higher ones are selected too.
A selector is one or more facilities (separated by commas), a dot, then the priority. More complex selectors are possible too; one such is shown below.) Some example selectors:
mail.*       mail facility, any priority
mail.debug   mail facility, debug or higher priority (same as *)
mail,news.*  all messages from mail or news
auth.warning all security messages of warning or higher priority
*.info       all messages from any facility except debug msgs
*.=info      any facility, info msgs only (and not higher)
*.!err       any facility, pri <= err only
*.!=alert    any facility, any priority except alert
*.info;mail,news,authpriv.none
             all msgs with info or higher priority except
             mail, news, and authpriv
That last one is tricky.
Using multiple selectors on a single
line this way allows you to specify a general category first,
then for the matching log messages you can specify exceptions
using the special priority of none.
Always go from most general selector to most specific or your
setup may not log what you think it should!
Log messages don't only have to go to files, you can direct
them to user terminals, run them through other programs
(with a pipe, to email, to a pager or as a text message to your
cell phone, or to a log file analyzer/alerter),
or send them to another host running syslogd (a central loghost).
(This last is handy if you have a network of computers you must monitor. Besides consolidating many log files, there is great security in using a remote log server that has no other services on it. This is because when a server is hacked the attacker usually destroys the log files. This scheme protects against disk crashes too.)
Here's the syntax for the actions:
/complete/path/of/some/file /dev/console -/complete/path/of/some/file username1[,username2 ...] * @remotehost @log.example.com;
start the remote syslogd with
-r|/path/to/named/pipe /var/lib/cmd.pipe with the mkfifo
command.
Then start the command with
cmd < /var/lib/cmd.pipe.)
logger is a command line utility you can use to send log
messages to syslog.
It is often used in shell scripts used as daemons.
It is handy for testing your syslog configuration too.
The syntax is simple:
logger [-p facility.priority] [-t tag] message
The default selector is user.info,
and the default tag is logger.
You can also copy a file to the logs.
Here's an example of copying some-file to the system logs:
logger -t "backup script" -f some-file #or < file, no -f
This will send all lines of some-file as individual log messages.
One problem with log files is that over time they grow. When a system is experiencing problems the log files can grow very large, very quickly. Periodically trimming or removing log files is necessary. This is known as log file rotation.
The most popular scheme is to rename a log file log
as log.1 and to start a new log file.
Next time, log.1 is renamed to log.2,
log is renamed to log.1,
and a new log file is started.
This continues for N previous files, and older log files are
deleted or archived.
An even better scheme is similar, but use the date the file
was rotated as the extension, rather than a simple number.
Instead of discarding old log entries, consider archiving them to some cheap backup media. You never can tell when old log records will come in handy. (But, be careful with privacy and security issues!)
Since dealing with log file rotation is a common problem,
most systems have a standard way to deal with it.
On many Linux distributions you have the logrotate or
a similar command.
This command usually runs via one of the cron facilities
(on Fedora, it's run from anacron).
Using logrotate, you can set your log rotation policy
for any log file by editing the file logrotate.conf,
or editing files in the /etc/logrotate.d directory.
(Using multiple configuration files is best when you have multiple
rotation policies for different groups of log files.)
Here's a sample logrotate.conf file:
#Global settings:

# rotate log files weekly
weekly
# keep 4 weeks' worth of backlogs
rotate 4
# Create new (empty) log files after rotating old ones
create 0644 root root

# Per log file settings:

/var/log/cups/*_log {
    missingok
    notifempty
    errors root
    postrotate
        /etc/init.d/cups condrestart >/dev/null 2>&1 || true
    endscript
}
You can configure logrotate to email to someone
the old log files it would otherwise delete, handy for automatic archiving.
When adding or enabling a new service, remember to configure syslog and log rotation to manage that service's log messages. If possible, configure the service to use syslog (and not its own log files). Remember that syslog and logrotate are independent; even when not using syslog, you still need to configure log rotation for new daemons that create log files.
Consider always rotating logs on a weekly or monthly basis. This makes it much easier to guess which log file to examine when looking for an old event.
Note: With Debian systems, the /etc/cron.daily/sysklogd
script reads the syslog.conf file and automatically
rotates any log files it finds configured there.
This eliminates the need to use logrotate for the common system
log files, but not for any daemon that doesn't use syslog.
There is another important reason always to rotate your log files:
the default syslog log file format timestamps don’t include a year.
If a system runs for longer than one year, tools such as
logwatch will start reporting the old events again!
Always rotate all log files at least once per year.
Non Unix/Linux systems also maintain log files, but usually not in syslog format. This may be a problem for the sys admin who must deal with a mix of Windows and *nix servers. Windows systems keep detailed event logs. Windows event log files are binary (not text like syslog). They are also fixed in size; when full, they erase themselves and start over, losing valuable data! (This policy can be changed from the control panel, and may not be the default in current Windows versions.) Although the logs are binary, the format is publicly available, and a number of Perl and other tools exist to convert these to text.
Windows logs are consistent across all Windows versions and services (e.g., Event ID 529 always means a failed login). And since event logging is built into the OS, it is generally more secure than syslog.
Windows provides no mechanism to forward events to a central loghost.
Instead, there are a number of third party tools for this, such as
Kiwi syslog for Windows, EventReporter, Snare for Windows,
and even roll-your-own with the Perl module Win32::EventLog.
The Windows event log is really three logs: the system log, the security
log, and the application log.
(Think of these as three syslog facilities.)
Each log is stored in a separate file:
...\system32\conf\SysEvent.Evt,
...\SecEvent.Evt, and ...\AppEvent.Evt.
Applications must register themselves to be able to use the event log
service (see registry key
HKEY_LOCAL_MACHINE\System\CurrentControlSet\Services\Eventlog\Application).
System and service event logging is controlled by the Windows Audit Policy (Control Panel→Administrative Tools→Local Security Policy→Audit Policy).
Windows provides logevent (equivalent to the Unix/Linux
logger command line tool) to create event log messages.
For older Macintosh systems (OS9 and earlier), you can use the syslog
compatible netlogger tool.
Modern Macintosh is built on BSD Unix, and thus supports
syslog directly.
Log management is the method of collecting, parsing, storing, and analyzing, log files and/or log messages from your applications, servers, and other infrastructure components to provide insights for troubleshooting, debugging performance issues, and identifying security threats. (From signoz.io, accessed on 6/12/2024.) For larger deployments (hundreds of log sources including servers, applications, network infrastructure), you need more than simple syslog, which was designed mostly for single host log collection and doesn't scale. There are many free and commercial tools for this, as well as suites of tools known stacks. One of the most popular is the ELK stack, which was released with a free and open source license. A popular commercial tool is Splunk. Others include GrayLog, Loggy, and New Relic.
“ELK” is the acronym for Elasticsearch, Logstash, and Kibana, three tools from Elastic.co, and is one of the most popular log management tool suites. Elasticsearch collects the log data, stores it in a searchable database, and can analyze it and forward alerts and summaries to dashboards. Logstash ingests data from a multitude of sources, transforms it, and then sends it to your favorite "stash" (database) such as Elasticsearch. In recent years the simpler beats data aggregator has replace Logstash but the acronym wasn't changed and both are still supported (2024).
Each of the tools in the stack are independent and thus can be used alone or in combination with other tools. Because of this power and flexibility, ELK can be difficult to initially setup on your own, but it is definitely doable. Like many log management tool suites, the company behind ELK offers paid support and cloud versions they will manage for you.
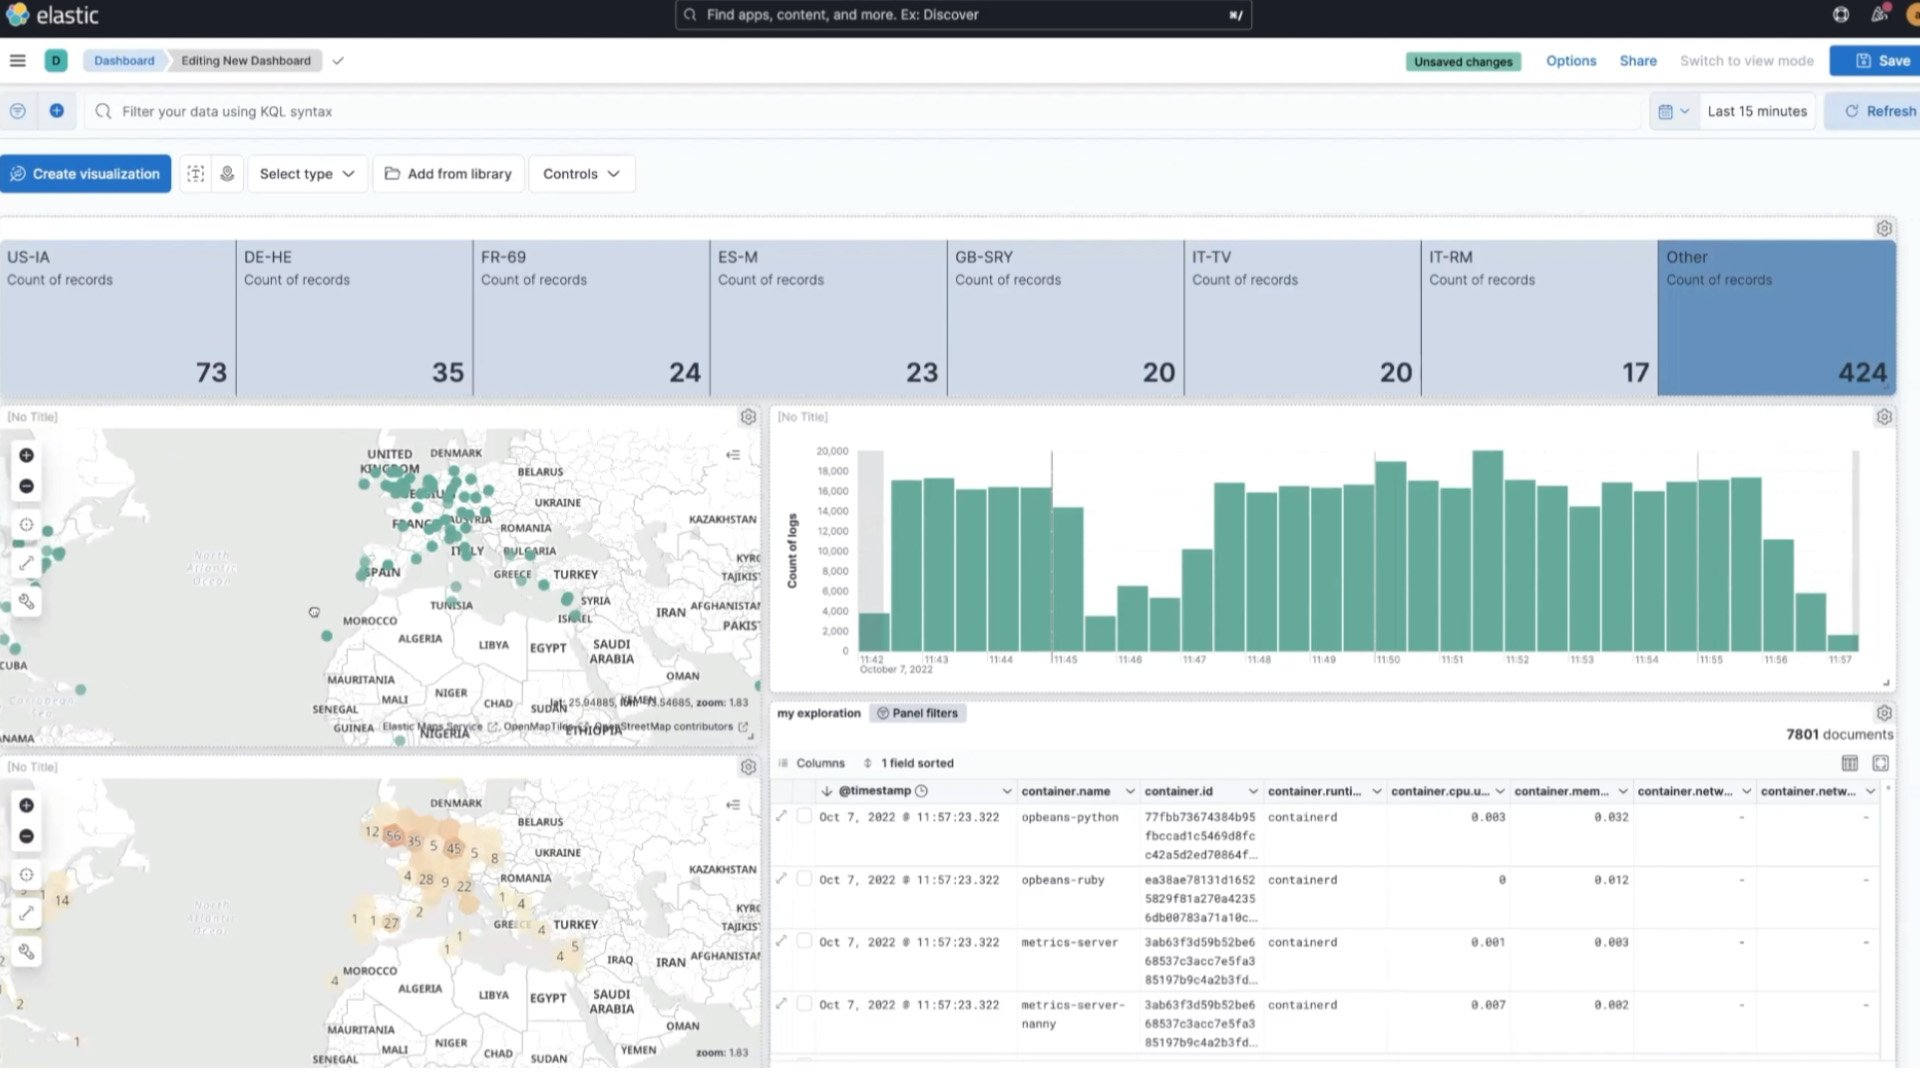
The user interface is the tool Kibana. This offers a dashboard and an interactive query panel, and is considered high quality. (See this kibana dashboard image from www.elastic.co/kibana/.)
Elastic changed the license of Elasticsearch and Kibana from an open (Apache 2) license to a proprietary dual license, for some components. (They changed the license back to an open source license in 2024, but not the same one.) So for large enterprise deployments it many cost money, as do most of the better log management and analysis tools.
SIEM stands for Security Information and Event Management. It is just security-focused (audit) log management, although SIEM tools can also use information from metric monitoring tools and other sources. SIEM is its own field with its own tools, although many log management suites can handle SIEM needs quite well.
For more information, see ISCIA, csrc.nist.gov SP-800-92, or Microsoft Security 101 – What is SIEM?.